
Financial markets are traditionally described through clear reference points – support, resistance, entry levels, and exit levels. However, real price dynamics almost never fit into the framework of exact price marks. At XFINE, it is noted that in practical trading a level most often exists not as a line, but as a zone within which the balance of supply and demand is formed. The price may reverse without reaching the formal level, or briefly move beyond it and then return to the range. This deviation from the conditional reaction point creates what is known as price slippage, while execution slippage represents only a specific manifestation of this effect – a situation in which an order is executed outside the expected price.
The reason for such behaviour lies in the microstructure of the market. It consists of many participants with different objectives, time horizons, and capital volumes. Even if a large share of market participants focuses on the same price level, actual orders are distributed around it. Some orders are placed in advance, while others appear during price movement, forming a range rather than a single point. As a result, the market reacts not to a line as such, but to an area where the concentration of interest becomes sufficient to slow down the movement or trigger a reversal.
The classical model of technical analysis assumes two scenarios – a rebound from a level or its breakout. In practice, however, there is an intermediate phase between these outcomes, during which the price fluctuates inside a zone. If buyers or sellers start acting in advance, the reversal is formed within the range, without reaching the conditional line. If some participants enter with a delay or large orders are executed more slowly, the price may briefly move beyond the boundaries of the zone, creating a false breakout effect. As noted in reviews by the BIS (Bank for International Settlements), liquidity in the foreign exchange market is unevenly distributed and can decline sharply during periods of increased volatility, amplifying price deviations near key levels.
Analysis by central banks, including the US Federal Reserve, also indicates that during the release of macroeconomic data market liquidity temporarily deteriorates and price movements become less predictable. Under such conditions, even a small imbalance of orders can widen the zone and shift order execution away from expected prices.
It is in such situations that price slippage becomes most noticeable and is often perceived not merely as a technical platform error, but also as suspected quote manipulation or execution delays. In reality, however, the underlying cause usually lies in liquidity dynamics and market structure rather than in the actions of an intermediary. At XFINE, it is emphasised that a level should be viewed as an area of market interest rather than as an exact price point.
The scale of price slippage is directly linked to the volatility of the instrument and the selected timeframe. On highly liquid currency pairs such as EUR/USD, during calm market conditions the zone on daily charts is usually limited to a range of 15-25 points. On more volatile instruments, such as GBP/USD, zones are significantly wider and may reach 40-60 points, while intraday price action may cross the boundaries of the range several times, forming false breakouts without a trend change.
In commodity markets, the effect is even more pronounced. Gold, which is sensitive to inflation expectations and central bank policy, rarely reacts to levels with accuracy to tenths of a dollar. On hourly timeframes, the zone may amount to 3-5 dollars, while on daily charts it can expand to 10-15 dollars. At XFINE, it is noted that in these areas large participants often use short-term price spikes to redistribute positions. Oil demonstrates an even wider range, as its volatility is amplified by geopolitical factors and OPEC+ decisions.
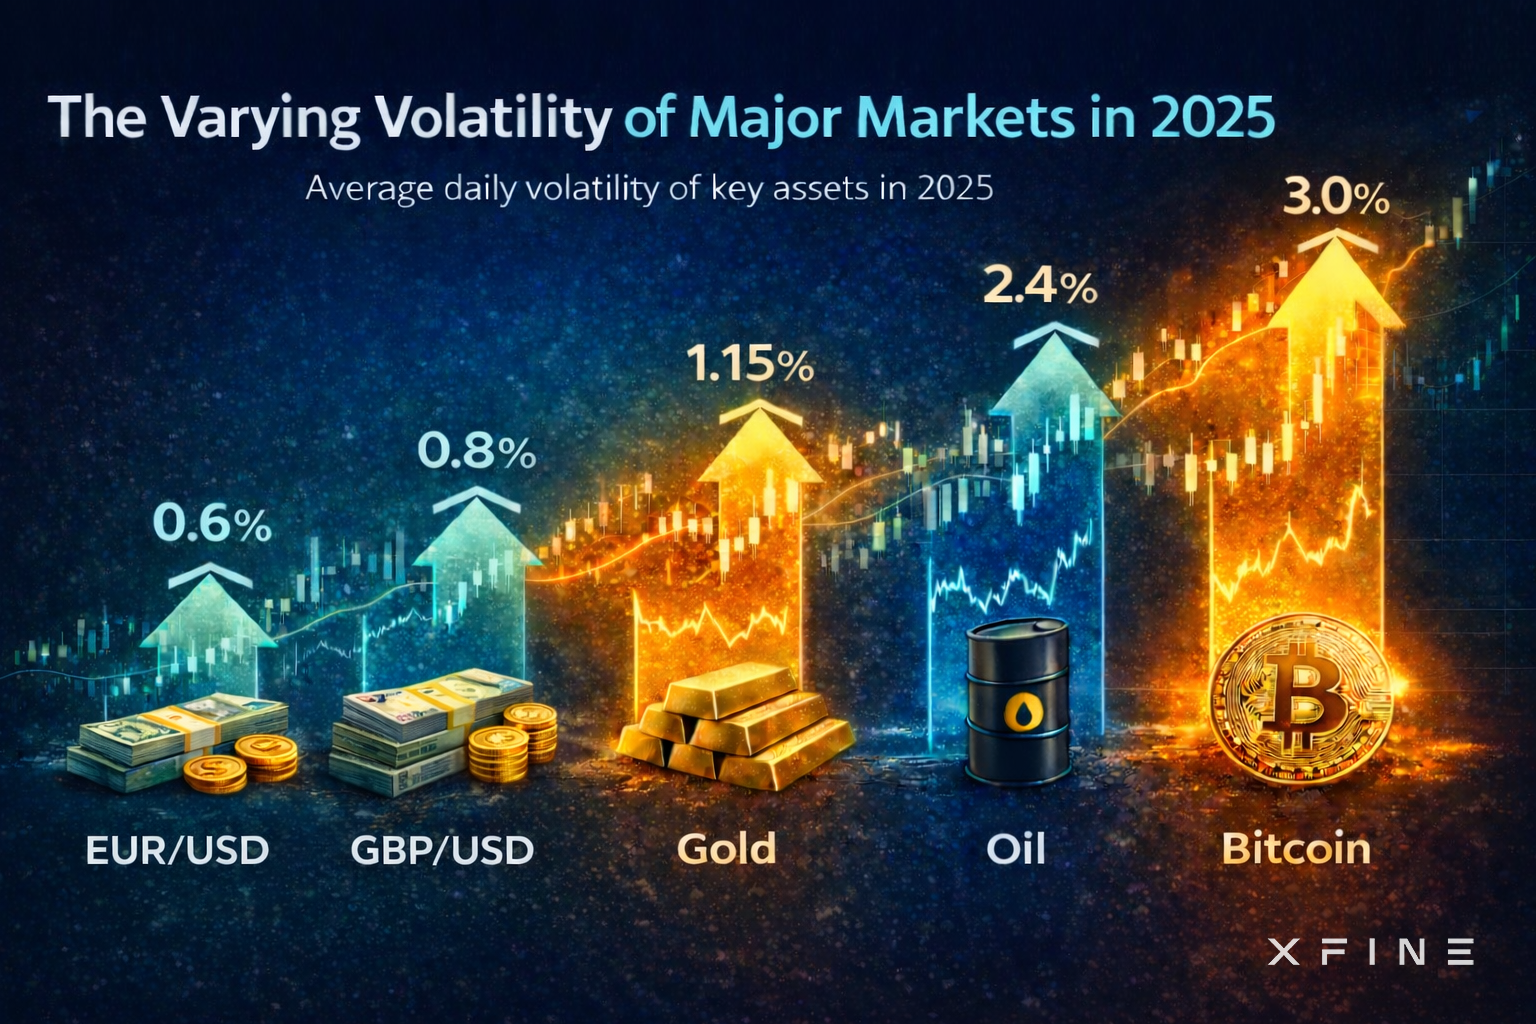
Data for 2025 clearly confirm the differences between markets. Average daily volatility in EUR/USD remained within 0.55-0.65%, while GBP/USD reached 0.75-0.90%, according to estimates by the European Central Bank. Gold in 2025 showed fluctuations of around 1.0-1.3%, according to CME Group data, while Brent crude oil ranged between 1.8-2.4%, with occasional spikes above 3.0%. The most pronounced price slippage was observed in the cryptocurrency market, where bitcoin maintained average daily volatility of around 2.5-3.5%, making point-based stop orders particularly vulnerable.
Understanding that the market operates with ranges rather than precise points makes it possible to abandon the illusion of accuracy and move toward more flexible risk management. At XFINE, it is believed that taking price slippage into account and working with zones rather than exact levels has become a key factor in the stability of trading strategies in modern markets, where volatility and the speed of price movements continue to increase.

